An update..


In an earlier post, I critiqued the reporting of First Solar and Apple’s PPA agreement involving an industrial scale solar installation. Apple CEO Tim Cook boasted that the electricity from the agreement could power 60,000 homes. The press release from First Solar, which was used rather uncritically by some reporters, was technically accurate (though a little misleading). However, there was a flaw in Apple’s calculation, using data from this document, and nobody seemed to have caught it.

The figure I calculated that reflected the actual residential delivery equivalent was 47,370 homes.

It seems as though First Solar has decided to make things clear. In an info page for the project,here, the household equivalency numbers reflect a lower estimate than Apple trumpeted: 48,000.

Posted in Uncategorized | Leave a comment

Reporting Apple’s Renewable Energy Investments

Recently, there has been much coverage of Apple’s 25 year PPA (power purchase agreement) with First Solar. This agreement provides additional funding for First Solar’s new 280MW California Flats Solar Project in Monterey County, California, and will provide the tech giant with access to the output from 130 of the 280MW.

It is a large, important agreement–it is the largest commercial agreement of its kind in U.S. history. But the way it was covered in the news provides an opportunity to describe some current problems reporting on renewable energy (and reporting more generally as well).

Many reports of the PPA used First Solar’s press release as a primary source. As you may have noticed, the press release says that “Apple will receive electricity from 130 megawatts (MW)AC of the solar project”, which is an accurate statement and alludes–though rather inconspicuously–to a difference between total capacity, generation, and delivery.

What is the difference? Well, “capacity” refers to the maximum output a generation source can produce under ideal conditions. That is, a 280MW project will produce 280MW 100% of the time at peak capacity. But this doesn’t ever happen. For any source. Coal and hydro included (though nuclear can be relatively close). Different sources, as you might imagine, have different capacity “factors”. These differences represent differing generative output. Generation, of course, refers to what is actually generated by a given source during a specified amount of time, and delivery refers to the electricity end-use customers have access to. Delivery, for example, will take line losses (losses in transmitting the electricity from source to end-user) into account.

So, capacity > generation > delivery.

Back to the issue at hand. The 130MW alluded to in First Solar’s press release refers to capacity. Projects are typically referred to based on their maximum capacity, so again, the press report is accurate. The problem emerges when reporters (eg James West at Mother Jones and Tom Randall at Bloomberg Business) take this 130MW as generation and not capacity. This can be seen in quotes from these stories such as “Apple will receive 130 megawatts from the project”. See the difference?

These two are certainly not the only offenders–this trend is quite common in reporting renewable energy news (as I have discovered in my research), but seems to me to be a significant problem because, using EIA’s capacity numbers (http://www.eia.gov/electricity/monthly/epm_table_grapher.cfm?t=epmt_6_07_b), solar, at best comes in at around 33% (in August). That is: on average, these panels will produce at about 1/3 their maximum capacity in August. The real problem here isn’t this semantic difference (not including the “electricity from” in the stories) itself between the press release and the stories–because really, do people know the difference between 130MW and 43MW (130 x .33)?

The real problems seem to me to be that reporters are simply recycling information from press releases without doing the work to check the facts, but also seemingly don’t have the background knowledge to understand the misstatement regarding the 130MW capacity versus generation versus delivery. There are a number of reasons why these problems exist, which mostly have to do with the decrease in specialist reporters and the increased speed of news (themselves rooted in decreasing news budgets and the dominance of internet news).

If people don’t understand the problem described above (capacity v. generation), then why do these problems matter in terms of renewable energy? Well, the articles also cite the fact that the electricity provided by the project is enough to supply 60,000 average Californian homes (according to Tim Cook). This is a scale designed to be comprehensible to the public, so perhaps it’d be a good idea to do the math.

1. Given 88,880,000 MWh consumed in CA in 2013 (from EIA), and 12,542,460 households (from US Census), average household consumption =7.08 MWh/household in 2013.

2. (24 x 365; number of hours in a year) = 8,760 x 130MW x .331 (August’s capacity factor) = 376,942 MWh produced.

3. 376,942 / 7.08 = 53,240 homes

So, really, 53,240 is not all that different from 60,000. Perhaps its a mistake that can be forgiven (but this also doesn’t include line losses)…

But, what happens when we use an averaged capacity factor for the year instead of simply using the highest for the year?

(8,760 x 130MW x .2945 (average CF of the 4 months EIA data spans))/7.08 = 47,370 homes.

12,630 homes is a big difference.

Another question: What would the capacity factor have to be to match up with Tim Cook’s numbers? Using some algebra, we find that we would need a capacity factor of about .36 to deliver that much electricity, but that would have to be even higher if we were to account for line losses.

It is quite possible that given the location and conditions at the site, and the particular solar technology being used that this capacity factor is realistic and accurate. The problem is that this information is not present in the press release and reporters are simply taking Apple and First Solar’s word for it. But because both of these companies have an interest in making the project look bigger than it is, reporters need to be a little more vigilant in unpacking the content of press releases and making sure they are not simply passing along purposeful misrepresentations about renewable energy technologies.

Posted in Environment and Energy | Leave a comment

A quest for political capital or a new era of witch hunts?

Recently, climate skeptic Wei-Hock Soon’s research and Congressional testimony has been the center of a debate about conflicts of interest in academia, as he was discovered to have accepted $1.2 million of donations from oil companies and interests that went undisclosed in much of his academic work. This work, according to documents requested by Greenpeace under the FoIA, he referred to as “deliverables”, as he did his Congressional testimony (According to this NYT article). He also he has very little training in climate systems…and his PhD is actually in aerospace engineering…

Now, in an attempt to ride the coattails of this controversy and seek some of this emergent political capital for his own, Rep. Raúl Grijalva (D-AZ) (the ranking member of the House committee on natural resources) may have ushered in a new era of political gamesmanship for Democrats. Those on the left, typically advocates and defenders of science and scientists, are not often associated with attacks on academics such that Rep. Grijalva has recently launched. He has recently initiated “investigations” into the work and funding of 7 academics, and included in this group is CU-Boulder’s Professor of environmental studies, Dr. Roger Pielke.

Dr. Pielke’s work on disasters and climate change is very interesting, very polarizing, and very important. While being classified by Rep. Grijalva, his office, (and “compliant journalists”, according to Pielke) as a “climate skeptic”, Dr. Pielke’s corpus of work certainly does not fit this classification. As a former student and mentee of Roger’s, this is so off-base, incorrect, and unintelligent that it really seems absurd: both strangely amusing and somewhat frightening. The empirical (let alone statistical) linkages between global temperature change, global weather patterns, regional/local patterns, disaster frequency and strength, and the costs of disaster prevention and amelioration are complex–and are certainly NOT bound by the common sensical notions much of the public and media seem to rely on when discussing the dangers of climate change. This, of course, is the point and value of Dr. Pielke’s work–to highlight the difficulties in effectively dealing with the complexity of climate change as a policy problem as it exists at the science-politics-policy-(mass media) interface. Pielke summed this complexity in Congressional testimony: It is “incorrect to associate the increasing costs of disasters with the emission of greenhouse gases.”

Dr. Pielke is now simply being vilified by Grijalva and many on the left (politicians, pundits, policy wonks, and media workers) for being what an academic should be–honest, rigorous, and a challenge to status quo thinking when necessary.

What does this all mean? Well, we will have to wait and see. Dr. Pielke has been nothing if not very open and honest about his funding (He has testified before Congress in the past and has thus disclosed his funding sources). His work–to anyone who knows anything about climate science and policy–is certainly not that of a climate skeptic. Rather, his work is much more appropriately represented as “pragmatist” in nature. While Roger may well think that this is a witch hunt directed at him (and he is mostly correct, I think), this also may well simply be a politician doing what politicians often do–use the visibility of an emergent public issue to build political capital. Here, Rep. Grijalva, now an apparent climate hawk, seemingly seeks to be “tough on skepticism”(though under the guise of being thorough in reviewing the funding background of policy-influential academics), as many were “tough on crime” in the 80s and early 90s.

Let’s just see how this plays out—we’ll need to keep an eye on how important climate change is in Grijalva’s 2016 re-election run and what political capital this earns him as ranking member of the energy committee. Further, will this encourage more Democrats to use academics as political pawns? Let’s hope not. It’s a dangerous precedent to set.

In the end, Rep. Grijalva’s “investigation” will yield nothing of substance about Dr. Pielke’s work or funding, though it may well damage his reputation as a public intellectual and increase the odds of Grijalva’s re-election (and thus, his continued power in the energy committee). That is the point, and the most dangerous outcome, of all of this.

As Roger himself says: “The incessant attacks and smears are effective, no doubt, I have already shifted all of my academic work away from climate issues. I am simply not initiating any new research or papers on the topic and I have ring-fenced my slowly diminishing blogging on the subject.”

Dangerous times, indeed.

Posted in Uncategorized | Leave a comment

Wind Energy’s “Social Gap”

offshore1

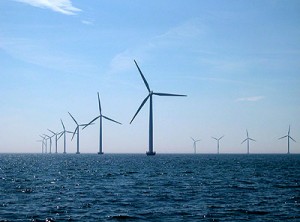
In 2005, Environmental Politics published research by Derek Bell, Tim Gray, and Claire Haggett called “The ‘Social Gap’ in Wind Farm Siting Decisions: Explanations and Policy Responses.” In it, the researchers attempt to explain the gap that exists between high levels of public support for wind energy and a relatively low level of wind commissioning and deployment.

In a recent issue of Environmental Politics here, these researchers (along with an additional researcher, Joanne Swaffield) interrogate and update their model (using data from the UK), based on critiques of their work and developments in the field more generally. Originally, and simply, the model described three reasons for the gap: a “democratic deficit”, wherein there exists local elite influence in wind siting; qualified support amongst wind supporters; and NIMBYism. Crucially, the approach relies upon typologizing wind energy opinions in the public (qualified supporters, unqualified opposition, potentially NIMBY-driven opponents and in the newest article, the authors add “place protectors”).

Importantly, the authors also added the consideration of conditions (and interaction thereof) through which qualified support varies, such as the degree of local input in the process, the limiting of bird deaths, and the dampening of noise.

Taken together, these additions to the model are critical, and strictly in terms of political and policy considerations, are headed in the right direction. Rightly, the authors’ reinterpretation and interrogation of their model is primarily constituted in two questions: What is the character of public opinion on wind?; and, What are the relations of power in the local politics of wind development? According to the authors, “Together these two should explain the social gap” (130).

Understandably, the researchers seemed to have traded the consideration of full context for analytical rigor. While local power dynamics are crucial, there needs to be more consideration and elucidation of larger scale dynamics of power–state, national, transnational, media, corporate, etc. Without this, properly contextualizing the dynamics of local politics and the conditions that qualify support will be unlikely.

This exclusion is typical of much research in politics and policy. However, much of this type of research is rendered decreasingly valid with the explosion of spaces of contestation in policy processes, along with the oft-ignored influence of cultural inputs in these processes. This cultural influence is expressed in social movement campaigns, elite policy discourses, and news coverage of wind energy debates, for example.

As researchers move forward, I would suggest a few things for this promising model:
1. Carefully consider the validity of attitude/public opinion typologies. I am not convinced they are terribly useful, especially considering the authors’ own recommendation concerning the consideration of the conditions of support. Meaningfully integrating this consideration into the model would probably explode the typologies.

2. The connection between support for an abstraction and support for a material manifestation of said abstraction is not straight-forward, as the research design of this work implies. Why would we suppose that there is a necessary connection between broad public opinion surveys supporting wind and support for a local project wherein poll respondents “have skin in the game”? The real issue this gets at is whether the “gap” is a legitimate yardstick to begin with. Further, how big of a gap is meaningful (as some critiques of this work have mentioned)?

2b. If the gap as a yardstick is validated, researchers might consider broadening the topic slightly and consider the social gap between renewables more generally and the public opinion polls that show support for them. This broadened level of analysis may help researchers better make their case for the existence of the gap (in general) while opening academic space for the study of the potential gaps for other renewable technologies. Further, this approach would facilitate the analysis of commonalities across technologies and contexts, and researchers would then be able to more broadly comment upon the locations and character of domination, resistance, agency.

3. Interviews with stakeholders at multiple levels would make the authors’ three “refinements” much more meaningful. Getting at the specific reasons for (and machinations of) support or opposition will yield much more meaningful categories, and if done at multiple wind farm sites (or, again, in many studies), will allow researchers to discuss generalities that are more valid and well-grounded.

All in all, the questions these researchers are asking are critical, but they need to be done with a little more consideration for nuance and context.

Posted in Environment and Energy | Tagged , | Leave a comment

Energy subsidies…such a muddled discourse!

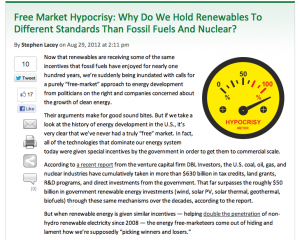
This write up by Stephen Lacey on Climate Progress does a great job of discussing energy subsidies in the U.S.

In particular, the article discusses the falsity of assertions that renewables receive the lion’s share of energy subsidies. In fact, they receive much less than fossil fuels do, under most operationalizations of “subsidy”. The success of the “subsidy dependence” narrative in political discourse is disturbing, and very dangerous. As this article notes, the Republican platform has recycled their tried-and-true “winners and losers” soundbyte–thus marginalizing renewables in the Republican base–the very people least likely to support renewable energy development.

The simple fact is, as the referenced report from The Breakthrough Institute notes, that the natural gas boom is a direct result of federal investment in R&D. The partnership of private initiative and public investment in energy is a fully normal, historical, and fruitful way to develop new, clean, energy technologies–whether for solar, wind, natural gas, oil, or coal. A little courage from Republicans (dare I say, like G.W. Bush showed a bit of) in honestly evaluating and communicating renewables would go a long, long way.

Posted in Environment and Energy | Tagged , | Leave a comment

The Growth of Natural Gas

This article from Yale Environment 360 takes a look at natural gas as the critical piece of the U.S.’s energy future.

The piece does a good job of discussing the environmental problems of our move toward natural gas, the potential for natural gas price fluctuations (just because supply has shot through the roof doesn’t mean price will stay low and steady), and the need for renewables (free fuel) as a hedge for this price uncertainty. The article also covers the impact of a natural gas infrastructure on climate in a general fashion (that is, it has less climate-warming potential than coal). Though the logic is solid and I agree with the argument, the primary thing that is missing (as a commenter notes) is a lack of discussion of methane leakage.

Most anybody who knows climate science understands that methane, though it has a shorter life-span in the atmosphere, has much more (about 23x) heat trapping potential than CO2. If natural gas is indeed going to be realized as a way to further lessen the U.S.’s carbon output, a stiff regulatory structure to address leakage NEEDS to be in place, and be in place QUICKLY. If we indeed will need more than a million wells to extract our natural gas, and the new wells are to be built quickly (about 100 oil and gas wells were drilled in 2010 every day), there is serious potential to make the climate situation worse if methane leakage occurs at even a fraction of these new wells.

Many reports about natural gas these days ignore the issue of leakage. The rapid emergence of natural gas as a climate-friendlier energy source, the highly political nature of energy and climate, strong lobbying by the oil and gas industry, and understaffed federal agencies with highly politicized bureaucratic structures only exacerbate the potential of the natural gas boom to do more harm than good. We need to address this problem before the cure (gas) becomes as harmful as the disease (coal).

Posted in Environment and Energy | Tagged , , | Leave a comment

Deciphering (wind) power…what do the numbers mean?

Currently, wind power is the most widespread and proven renewable energy electricity generation technology. While it has come a long way in the last decade, there is still much more to be done. The PTC (production tax credit), which is essential at this point for making many wind projects financially feasible, is due to expire at the end of the year. This article at Greentech does a good job describing the issue. The article also covers the benefits renewables can offer in terms of job creation, which by most measures, is quite significant (the source of their data notwithstanding).

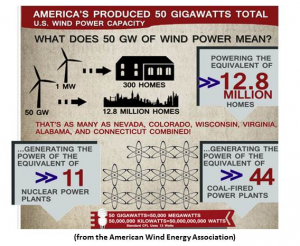
However, as the headline indicates, the growth of installed capacity in the U.S. to 50 GW is the point. This statement, in and of itself, is rather innocuous. It is a more-or-less straightforward statement of fact. Crucially however, the infographic from AWEA offered up in the article really simplifies things. The graphic makes the assertion that 50 GW of installed wind capacity is equal to generation of 44 coal plants (or 11 nuclear plants). The actual output of coal plants can vary widely, however. There are details on graphics like this that are unnecessary, but when juxtapositioning wind and coal directly, the devil is in the details. How big are these hypothetical plants? Or, more exactly, what is their generation capacity? Is the estimate reasonable?

In 2009, coal plants in the U.S. generated at 64% efficiency. To wonks, this is the “capacity factor”. This metric describes the total generating capacity of a plant or fuel, versus what is actually generated. Nuclear historically has the highest capacity factor (about 90%), and factors for other fuels depend on the variables that affect that fuel. The capacity factor for hydro, for example, depends on precipitation and other variables. Capacity factor may be the most important variable in calculating the viability of new capacity construction (along with interest rates and the PTC), but it is uncommon to find it mentioned in news stories on the topic. You typically must go to specialty journals or websites for this information. See the table of capacity factors on page 48 of EIA’s 2009 Energy Annual here.

Wind is calculated to generate at about 48% in 2010, which has been improving steadily in the last decade. Wind capacity factors will be affected by average wind speed and the type of turbine, to name a couple of variables.

Back to the point…

Because the type of coal plant in the AWEA graphic is not stipulated, we must work on averages. The question is: Is the size estimate reasonable? How big are these hypothetical coal plants? 50 GW of installed capacity of coal at 44 plants works out to a per plant capacity of 1.14 GW. When considering coal’s average capacity factor for 2009 (2010, oddly, is not available at EIA as of now) of 64%, this works out to a rough total of 280,320,000 MWh of generation per year for these 44 hypothetical plants. Considering wind’s capacity factor (48%), 50 GW of capacity works out to (50 GW x 365 days x 24 hours)= 438,000 GWh (total generation capacity for one year) x .48 = 210,240 GWh, or 210,240,000 MWh. This number is significantly lower than 280,320,000.

Back to the per plant average. If we divide the 280,320,000 by 44, we get 6,370,909 MWh of annual generation per hypothetical coal plant. Now we simply divide wind’s hypothetical total generation (210,240,000 MWh) by the per plant average above (6,370,909 MWh), which comes out to just about 33 plants at the 1.14GW size. This was a rather long way ’round to the point that, given the information on the graphic, we don’t know what size coal plant AWEA is actually talking about and would just have to trust their math. More on this calculation below.

To figure out the size AWEA actually used, we would simply divide annual wind generation (210,240,000 MWh) by 44 plants. This works out to about 4,778,180 MWh generated per plant. Now, working backwards using this number and coal’s capacity factor, we know that (4,778,180 MWh / x) = .64. This means that “x” (total annual generating capacity) = 7,465,909 MWh. We must also now break this down and remove the temporal variable to get generating capacity. We do this by dividing (24 and 365) out of it, and get an 852 MW average plant generating capacity. This is a very reasonable estimate (though a bit off due to rounding).

Though this is a solid estimate, there are a couple of things about the graphic that might cause some misinterpretation.
1. As should be clear from the seemingly worthless calculations above, 50 GW of installed coal capacity will generate much more electricity than 50 GW of installed wind. It will just be much dirtier.

2. The capacity factor I used from 2009 to calculate coal generation was historically low. If you chose to do the calculations again using the capacity factor for 2008 (72%), you would find that AWEA’s estimate of 44 plants would be lower (it would actually be 39). Not a huge difference, but an important one to advocates. The devil sure is in the details..

Maybe plant size and capacity factors are extraneous details on an infographic like that, but hey, more transparency is always better than less.

Posted in Environment and Energy | Tagged , , , | Leave a comment

Communicating CO2 and natural gas

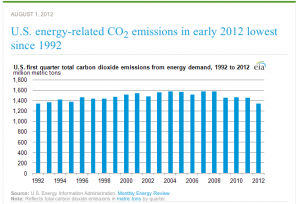
A recent report done by the EIA highlighted a drop in U.S. carbon dioxide emissions from energy consumption. According to the report, these emissions are at their lowest point since 1992.

Generally, this is good news. As the summary of this finding notes, there are a number of reasons for this reduction: a mild winter (and the concomitant reduction in overall household energy consumption), a shift in fuel use in energy generation from coal to natural gas, and a drop in gasoline usage (likely still an effect of the recession).

This is a critical time in the U.S.’s move to more carbon-friendly energy sources. There is a real opportunity for us to reduce our national carbon emissions, but we also need full transparency from researchers (both academics and government) and more life-cycle accounting of the carbon emissions from the natural gas extraction process. While it is true that gas is a much less carbon-intense fuel source, there are significant potential problems with its extraction, as some experts have noted. Uncombusted natural gas has the potential to trap much more heat than CO2, so it is crucial that these losses are accounted for when doing the calculus for natural gas’ CO2 benefits.

Considering the magnitude of natural gas’ potential pros and cons, getting the public accurate, thorough information is critical (and might be tough, according to a new NRDC report). News coverage of the incomplete EIA report, and the deeply flawed “fracking is safe” report from UT-Austin’s Energy Institute (more on that here) may lead the public to assume that natural gas is an energy panacea that is not. At least not yet.

Posted in Environment and Energy | Tagged , , | Leave a comment

Activist art or useless abstraction?

CNN recently published a story called “Artists tackle ‘man vs nature’ debate”. The story covers an art show in London that was designed to approach environmental activism from an artistic standpoint (as opposed in some ways to political, academic, or other more traditional activism. It isn’t a new idea, but it is an important one. Approaching environmental activism from a place that is positive, inspirational, and unique (as opposed to being dire, depressing, and repetitious like many environmental debates are these days). In terms of activism however, this approach is not without its problems. For those without art training, those who are relatively unexposed to art, or those who are unwilling to address the art in the manner the artist intended, much of what is going on in the pieces, and the show more generally, may be lost. This is especially true in cases wherein the message and/or medium is relatively abstract. This all begs the question: “What must art ‘be’ to be politically efficacious?” Does making a simpler piece with wider audience comprehension somehow betray the value of the piece as “art”, or devalue it politically? Take a peek at the reader comments for some insight into the debate.

Posted in Environment and Energy | Tagged , | Leave a comment

genetic evolution + environmental conditions + science channel = bad pop social science


The Science Channel’s series “Through the Wormhole” scientifically “explores the deepest mysteries of existence — the questions that have puzzled mankind for eternity.” The newest episode addresses the issue of genetic evolution, race, and intelligence.

The producers decided that it was useful to talk to an expert on dog breeding as a way to explain genetic evolution/mutation in humans. The operative assertion is: we can breed dogs for intelligence, so different “races” of humans could have evolved different levels of intelligence. They go on to talk to a controversial sociologist whose research supports this assertion.

Both experts present highly problematic arguments that support the idea that race can be a valid predictor of intelligence (the “towel test” the canine expert uses is an example of this). The show, unfortunately, leaves many of the more interesting and valid social-scientific discussions of race and of the relationship between genetics, intelligence, and behavior undiscussed or glossed-over. For example, the problematic nature of “race” as a biological fact (when it is indeed primarily a social one), the issue of “intelligence” (the definition and attainment of which is also primarily social in origin), the problems with the application of human-centered measures of intelligence to non-human animal behavior, and the false parallel between purposive animal breeding and more random human reproduction…

Importantly, characteristics that make up “race” and “intelligence” are more accurately represented on spectrums, rather than in (invalid) static categories. Drawing causal paths through these categories (vis-a-vis assertions about animal behavior) to make arguments about genetic evolution in humans is highly problematic, and ignores the accepted sociological discussions of these issues. This all makes for good TV, but seriously misinforms the public.

I am reminded of the coverage of climate denial…

Image: FreeDigitalPhotos.net

Posted in Environment and Energy | Tagged , | Leave a comment